
Whether you’re redesigning your website or just tweaking a page, every change you make should aim to increase conversions, leads and sales. But how do you know what’s working and what’s not? Enter the heatmap.
Heatmaps are a visual representation of how visitors are using your website. They track where your customers are clicking on the page and how many times each part of that page is viewed in their browser (called a scroll map).
As visitors use your site, the colours on the heatmap will change. Brighter areas indicate where there have been more clicks or impressions, while darker areas represent places on the page that are less popular.
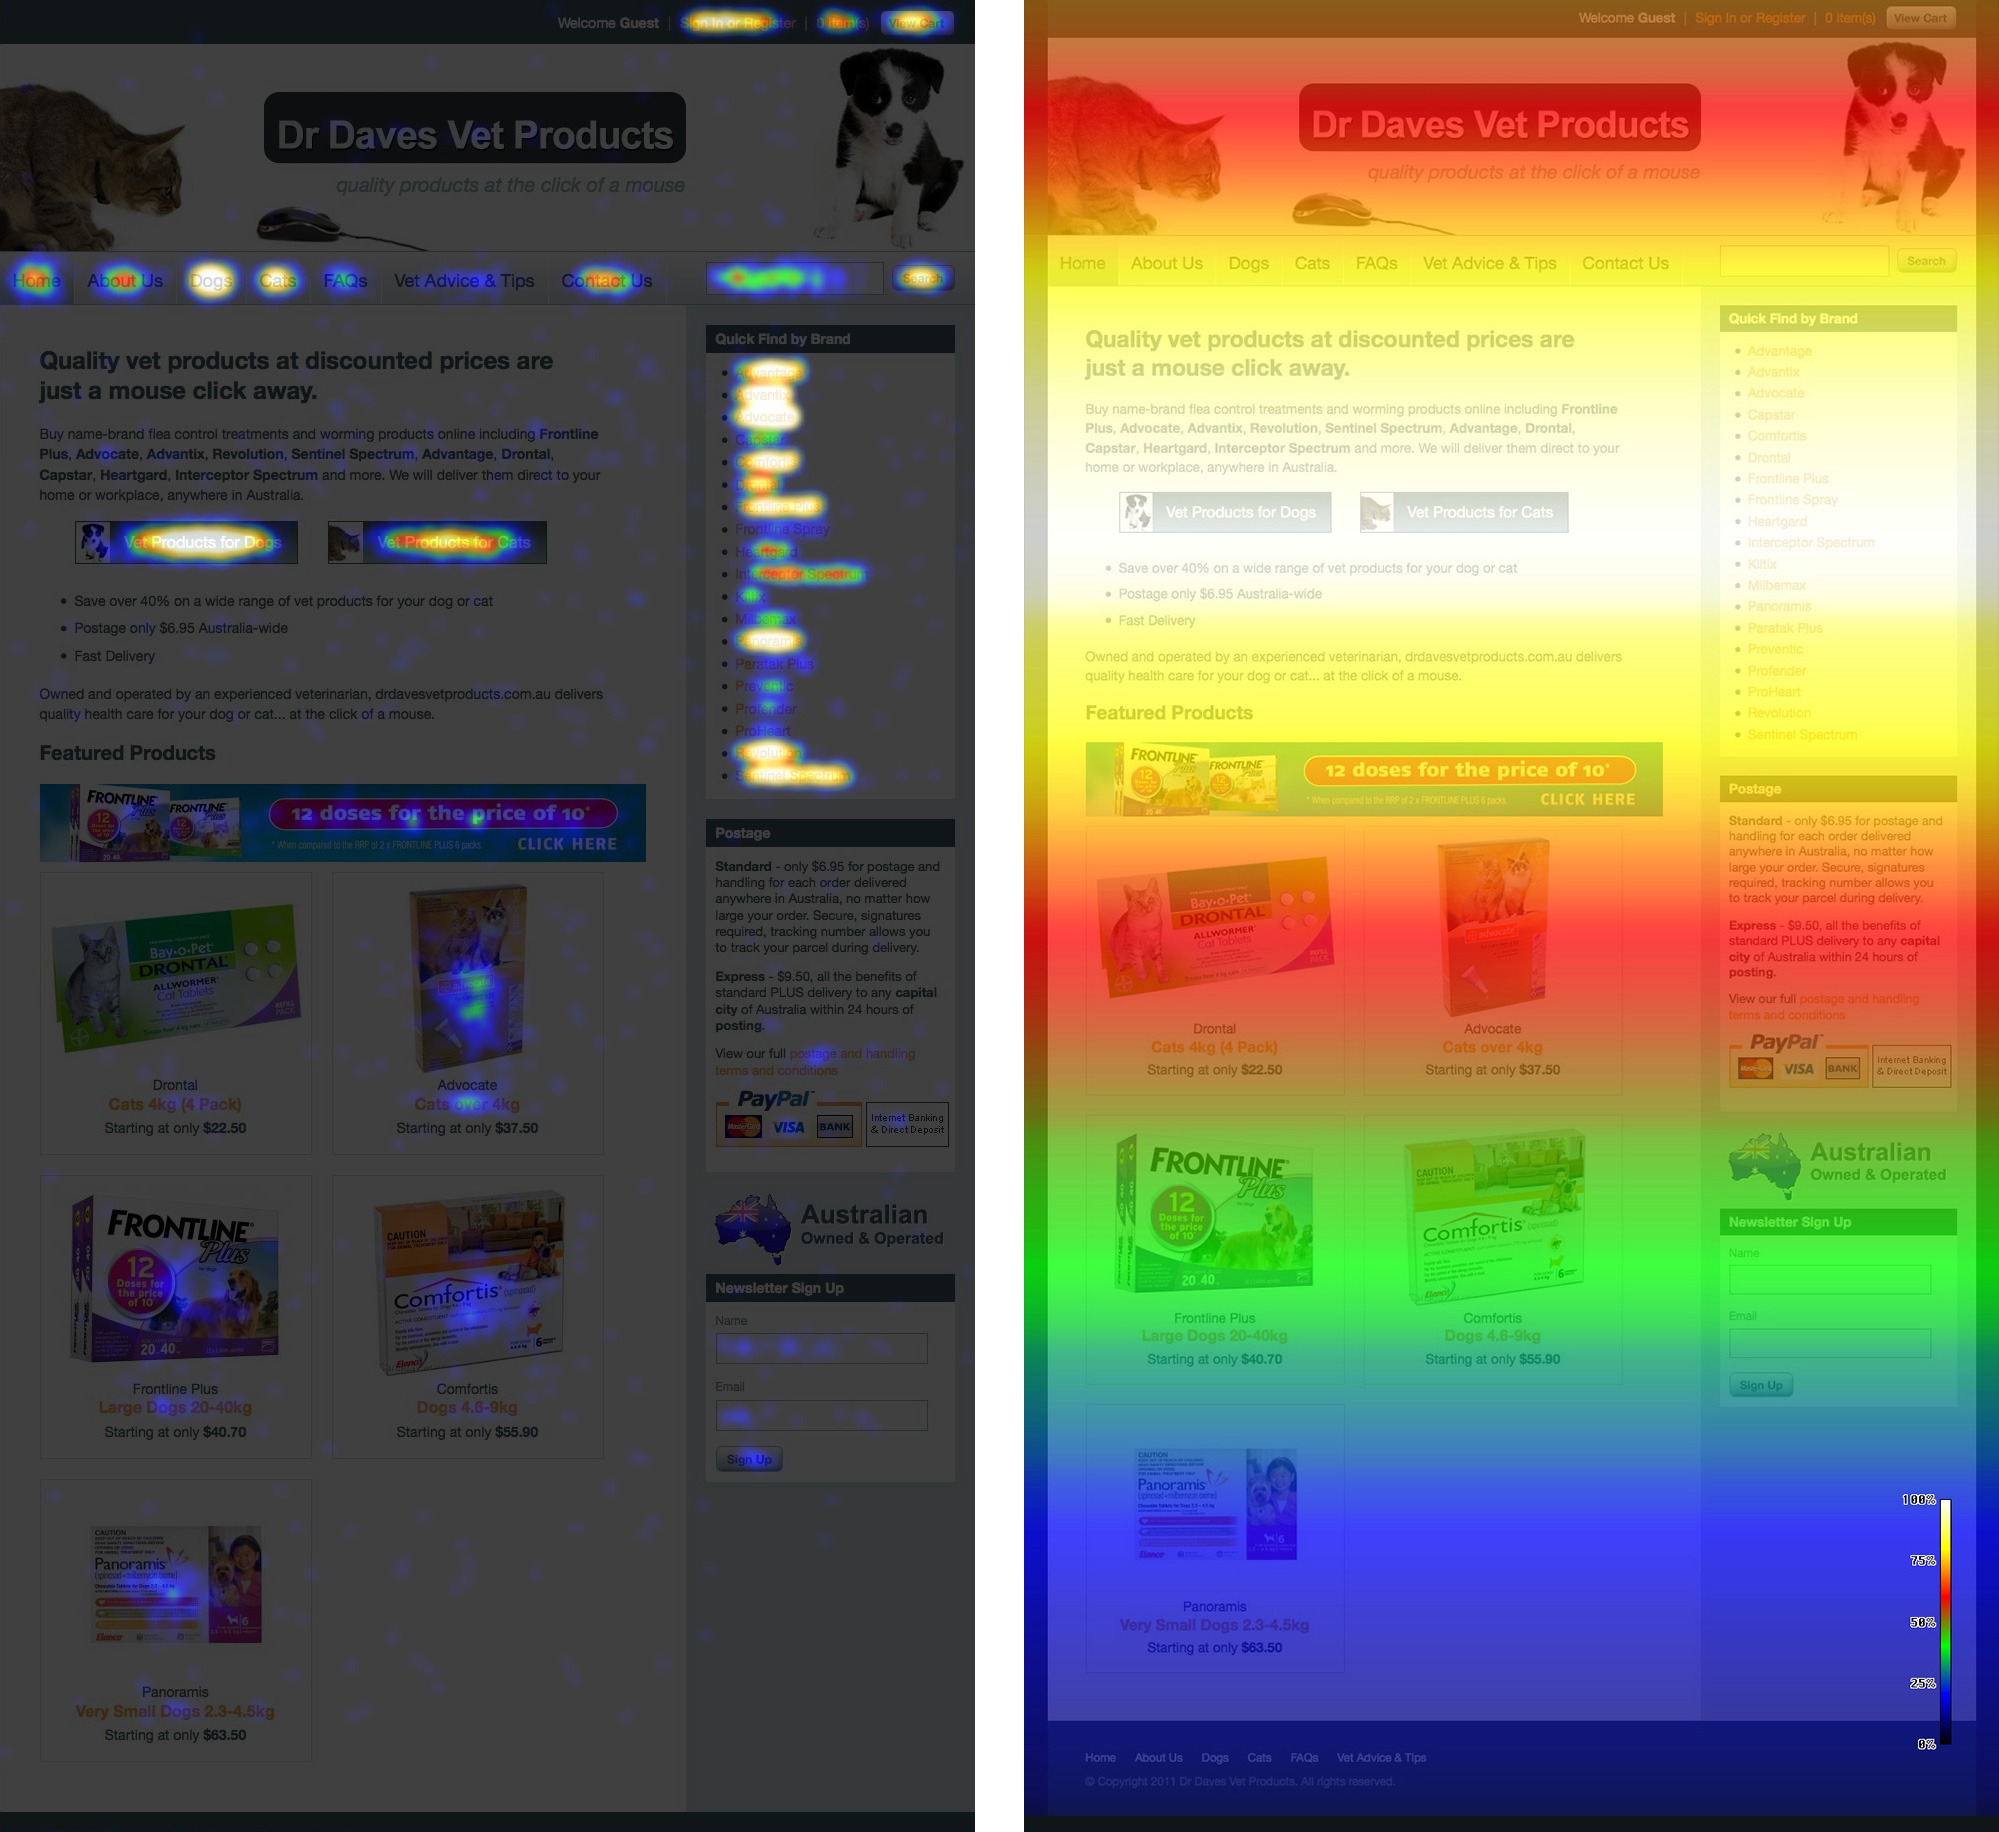
For example, from the heatmap and scroll of Dr Daves Vet Products, you can see that dogs are more popular than cats, some brands are more popular than others and most visitors don’t scroll to the bottom of the page. You can also see that the newsletter sign up and ‘Vet Advice & Tips’ areas have low engagement.
DR DAVES HOME PAGE HEATMAP / SCROLLMAP
How heatmaps can improve sales
There are a number of ways heatmaps and scroll maps can improve the performance of your website:
- Heatmaps take the guesswork out of optimising your website by allowing you to identify problem areas using real data.
- They can help you understand your customers better and keep them happy by improving their online experience.
- Your website will be able to keep visitors engaged and lead them towards the information and links you want them to see.
Data vs emotion
These days, you can’t just create a website and leave it to gather digital dust. It’s important to regularly assess how it’s tracking against your business goals and see if any tweaks are required.
By using real data to design and structure the content on your website (rather than vague, emotive reasons) you can make the most of the limited space on your website and the limited attention span of your audience. Heatmaps allow you to optimise your website, ensuring you attract more of your ideal customers and encourage them to take action.
Before we redevelop a site or optimise a landing page, we use heatmaps to capture all the insights from your existing website. These findings, combined with data from other tracking tools such as Google Analytics, help us understand how we can improve conversions on your site and ultimately increase profits.
Optimising your website with heatmaps
Once we have the data from a heatmap and scroll map, we can develop or adjust the navigation and page layout of your website to guide the visitor towards a purchase. Redfox redesigned the Dr Daves Vet Products website and increased conversions by 35 percent, simply by making a few adjustments to the page.
- Popular brands appear higher on the page, including within the top banner section which previously had no engagement at all.
- Visitors can now browse and filter the product catalogue easily by brand, treatment, life stage and breed size.
- Visitors can quickly flip between dog and cat products on the home page, with dogs set as the default as they received higher engagement in the heatmap.
- We moved the ‘Australian owned and operated’ message to the top as that is one of their key unique selling points.
Small changes can make a big difference
You don’t have to redesign your entire website to benefit from the insights that heatmaps provide. We worked with Urban Couture to optimise individual pages on their existing site, making small and incremental changes so we could measure each change and see whether it had any effect on conversions.
URBAN COUTURE HOME PAGE HEATMAP
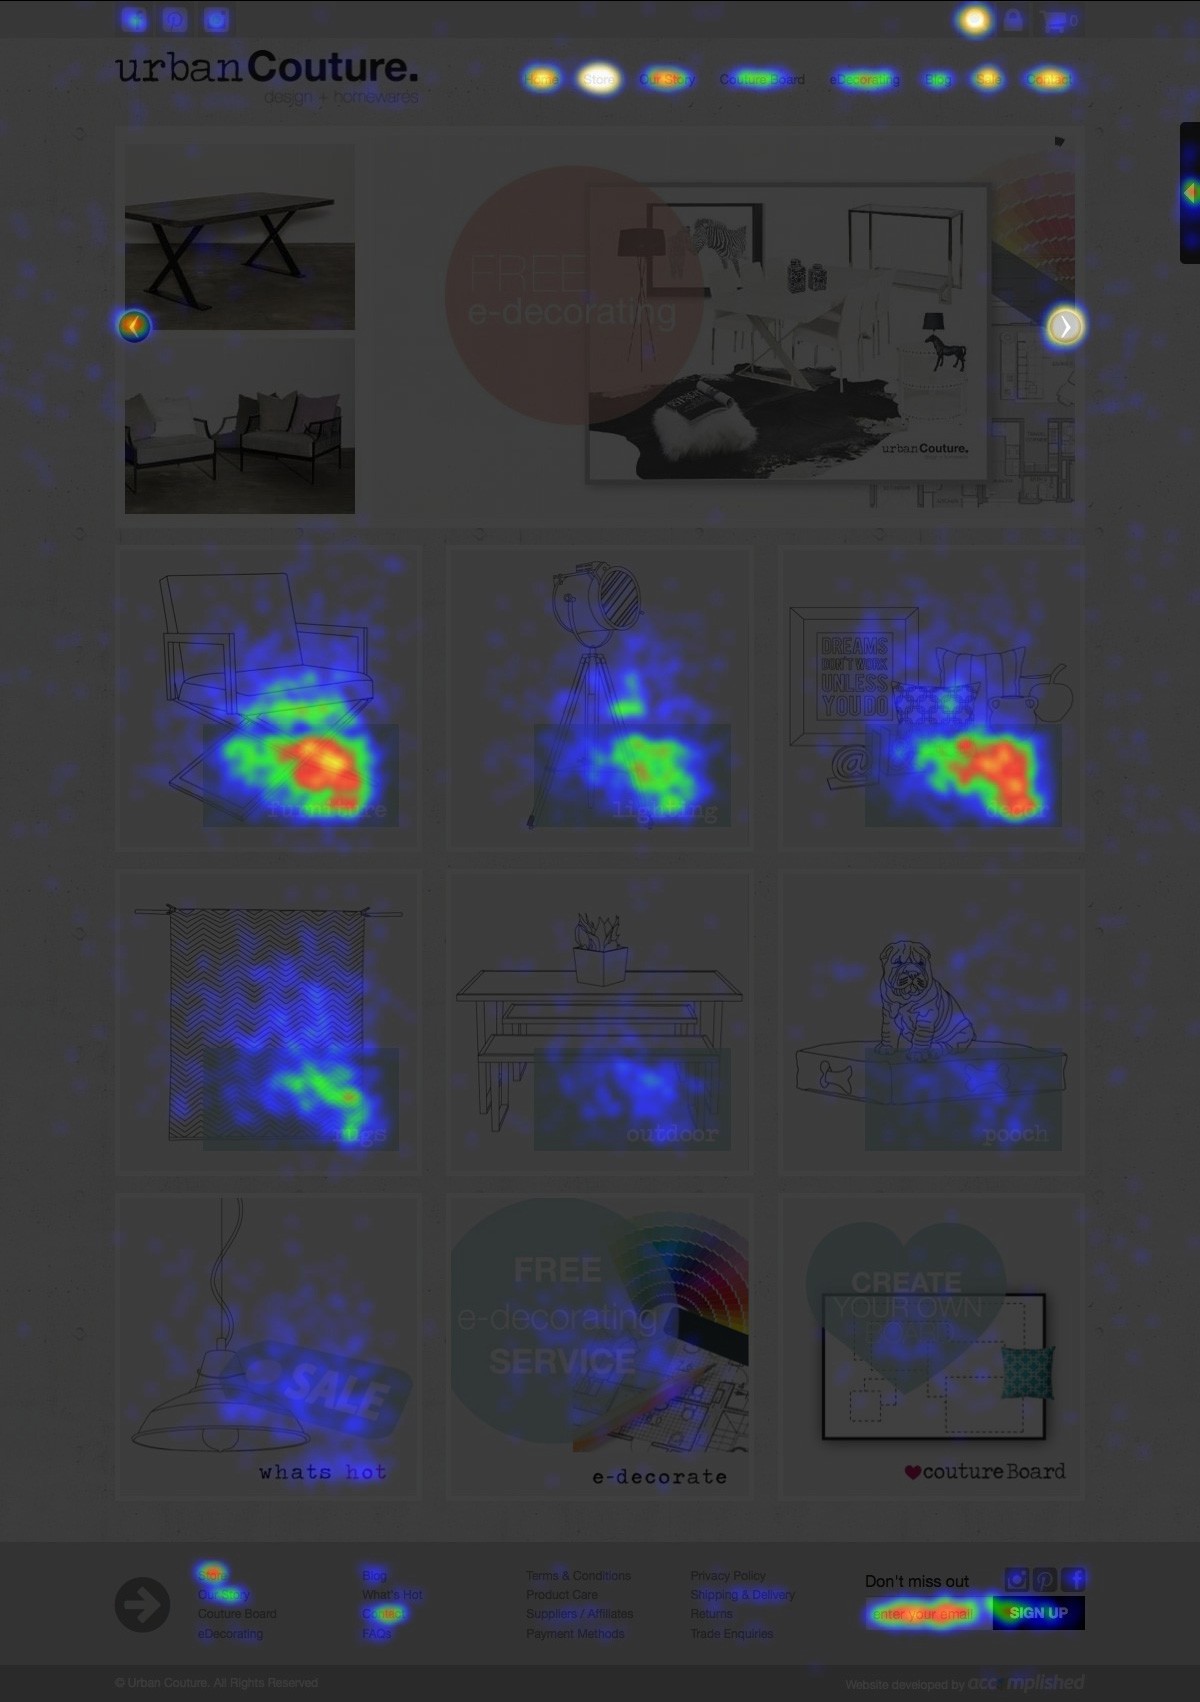
Using the heatmap above we made the following changes:
- The original newsletter signup had high engagement, but it was located at the very bottom of the page. By creating a popup window which prompts visitors to join a mailing list, we increased newsletter signups from an average of 36 per month, to a whopping 423 per month.
- We found that visitors were scrolling through the banner on the home page, however none of the banners had a clear call to action. They were also using the search bar to find the product catalogue. We created one banner image that encouraged visitors to browse the catalogue, which reduced the ‘time to click’ by 3 seconds, increased clicks to the store page as the first interaction by 31 percent, increased store page views by 6.86 percent and reduced exits from the index page by 12.85 percent.
Have you ever used a heatmap to understand how visitors are using your website? Contact us to find out how we can help.
